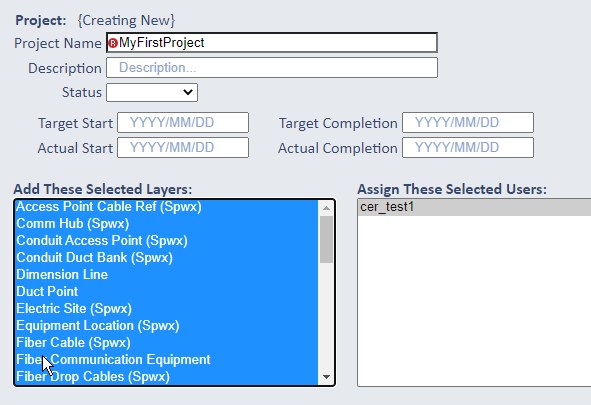
Project Settings
Enter the Name of your Project (required) and optionally a Description. Status, Start and Completion dates are all optional.
Also, all Sources you have defined are available here for selection to automatically add as new Layers in your Project.
This allows you to add multiple Layers at one time rather than having to select each Source individually when adding Layers after
the Project is created.
You can also add any/all of your named system Users to be assigned to your Project from this page.
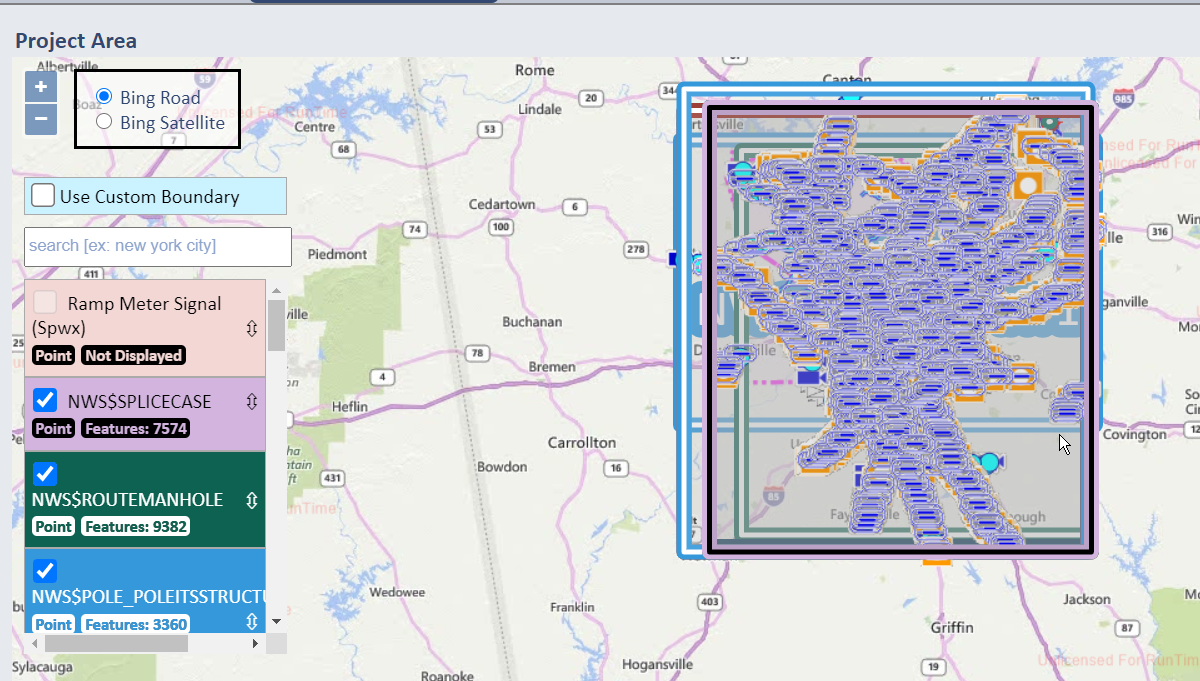
Project Area
The Project Area section on this page defines the working area of the Project. If you have existing feature data for your Project Layers
(from all configured Sources), the maximum extents of all combined Layer data in the X and Y directions (longitude and latitude) defines the "boundary"
of your Project. This bounding area is displayed in the SpatialWorx app as a thick dashed line that constrains the map displays to that working area instead
of leaving it open to the whole world.
However, it does NOT limit users to only working in, or placing features in, that specific area. If features are placed outside the defined Project
boundary it is automatically extended to accommodate the additional feature(s).
If you don't have any existing Layer data, the map will open showing a blank world map. As field users add feature data for any Layers you have defined and you open this page in the console you will see those features in the map.
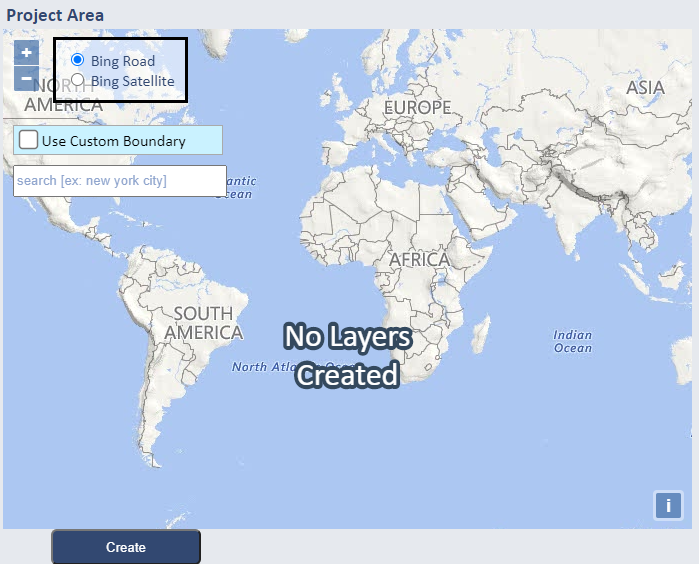
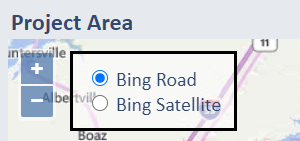
The Project Area map also allows you to toggle between Bing Road and Bing Satellite views so you can get a better idea how feature data will look on the map and how legible it will be for eiher basemap.
Custom Boundary
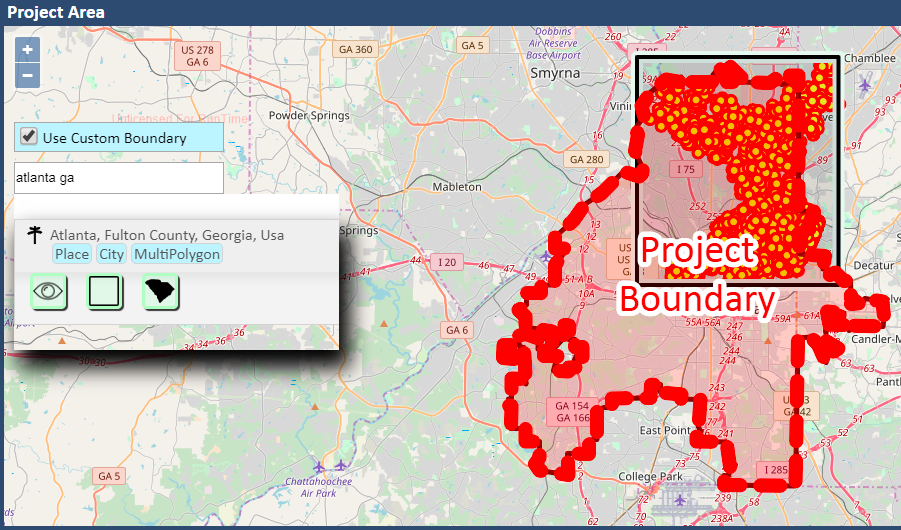
You can also override the default boundary and define a custom boundary that could be a boundary you draw or it could be tied to a specific geo-political region such as a county, city, or state. In the following example, a Custom Border has been applied to the same Source data. The Custom Border was achieved by:
- Selecting the Use Custom Boundary check box
- Entering a criteria of "Atlanta, Georgia" in the search box that becomes active after selecting the Use Custom Boundary check box
- Selecting the MultiPolygon option (
 )from the Atlanta, Fulton County, Georgia, Usa result set
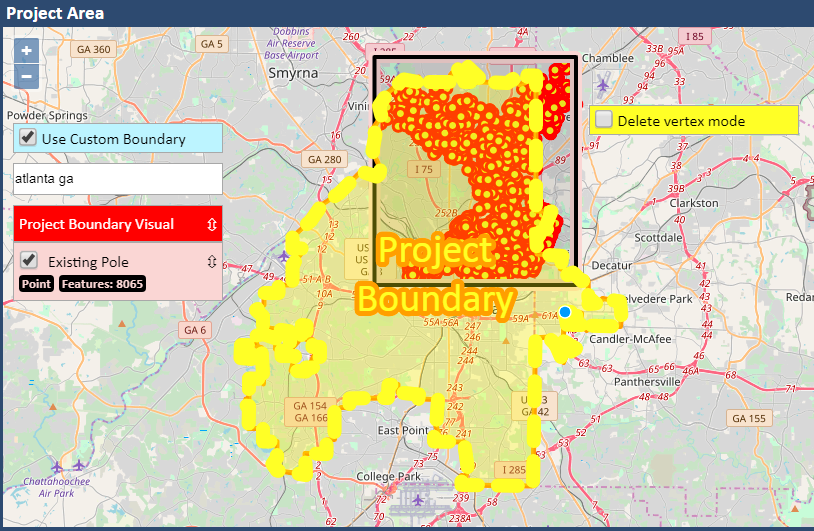
Clicking on the polygon that defines a Custom Border changes the color from red to yellow, and the Custom Border becomes editable.
Hovering over the now editable boundary, a blue dot displays along with the mouse pointer to indicate where a vertex can be dragged to a different location, thus redefining the bounding polygon for the Project.
A Delete vertex mode check box also displays, so that a vertex can be removed, again providing the ability to redefine the bounding polygon for the Project. Checking the Delete vertex mode check box allows multiple vertices to be deleted by clicking on a blue dot to remove that selected vertex. Unchecking the Delete vertex mode check box returns control to move vertex mode
Clicking away from the polygon disables the boundary edit function.
Layer Display Order
If you have source data for your Project on the left side of the map you will see a list of the Layers, the symbol type of each (point, line, or polygon),
how many features exist on each Layer, a checkbox to turn each Layer On or Off, and a move control. The order of the Layers in this list
also defines the order they will display on the map. You can change that order by dragging/dropping Layers in this list to reposition them and reorder
their display on the map.
In practical terms what this means is that you might have Layers whose symbols overlap one another at certain zoom levels. In that instance the
overlapping symbol might be the only one to display, but for field users you would prefer they see the other feature symbol on top (overlapping
the other) instead. Reordering them resolves
this issue.
Create Project
Once you have specified all settings for your Project select the Create button to create it. Once the Project is created you can assign any additional Users and Layers, and enable it for distribution to field users.